Every year we measure and report our greenhouse gas (GHG) emissions and produce an annual GHG inventory report in accordance with the International GHG Protocol, ISO 14046-1, and Aotearoa New Zealand Climate Standards.
Our emissions reduction target
In FY2025, we revised our short-term Scope 1 and 2 emissions target and set new targets for our long-term Scope 1 and 2 emissions, our Scope 3 emissions, and overall emissions. We also reset our baseline year for all targets, which has moved from FY2006 to FY2021. The table below sets out how we are tracking against each of our targets for FY2025:
Target type | Target | Percentage of target achieved | On Track? |
|---|---|---|---|
| Scope 1 and 2 short-term | Achieve a 44% reduction of Scope 1 and 2 GHG emissions (excluding transmission loss emissions) by 2030 | 72% | Yes |
| Scope 1 and 2 long-term | Achieve net-zero Scope 1 and 2 GHG emissions (including transmission loss emissions) by 2040, with an absolute target of a 90% reduction | 25% | Yes |
| Scope 3 short-term | Achieve less than a 64% increase of Scope 3 emissions by 2030; this is also a 35% reduction against Transpower’s forecast 2030 Scope 3 emissions | Overshooting target | No |
| Scope 3 long-term | Achieve net-zero Scope 3 emissions by 2050, with an absolute target of a 90% reduction of Scope 3 emissions by 2050 | Overshooting target | No |
| Overall short-term | Achieve a 15% decrease of overall Scope 1, 2, and 3 GHG emissions by FY2030 | 45% | Yes |
Overall, our total GHG emissions this year are up 16 per cent, primarily as a result of increases in our purchased goods and services, capital goods and construction. This is in line with our expectations.
Enabling the transition to a renewable electricity system is the biggest contribution we can make to reduce emissions. As we enable electrification by building new connection points and upgrading the national grid, our Scope 3 emissions are set to increase significantly due to the increase in embodied carbon and associated delivery works resulting from the physical construction and upgrade of infrastructure. This expected near-term increase in Scope 3 emissions is an essential byproduct of Aotearoa New Zealand’s electrification and will ultimately be offset by the net benefit of electrification to the country.
You can read more about our carbon footprint reduction initiatives in our Sustainability Strategy.
Our FY2025 GHG Inventory Report
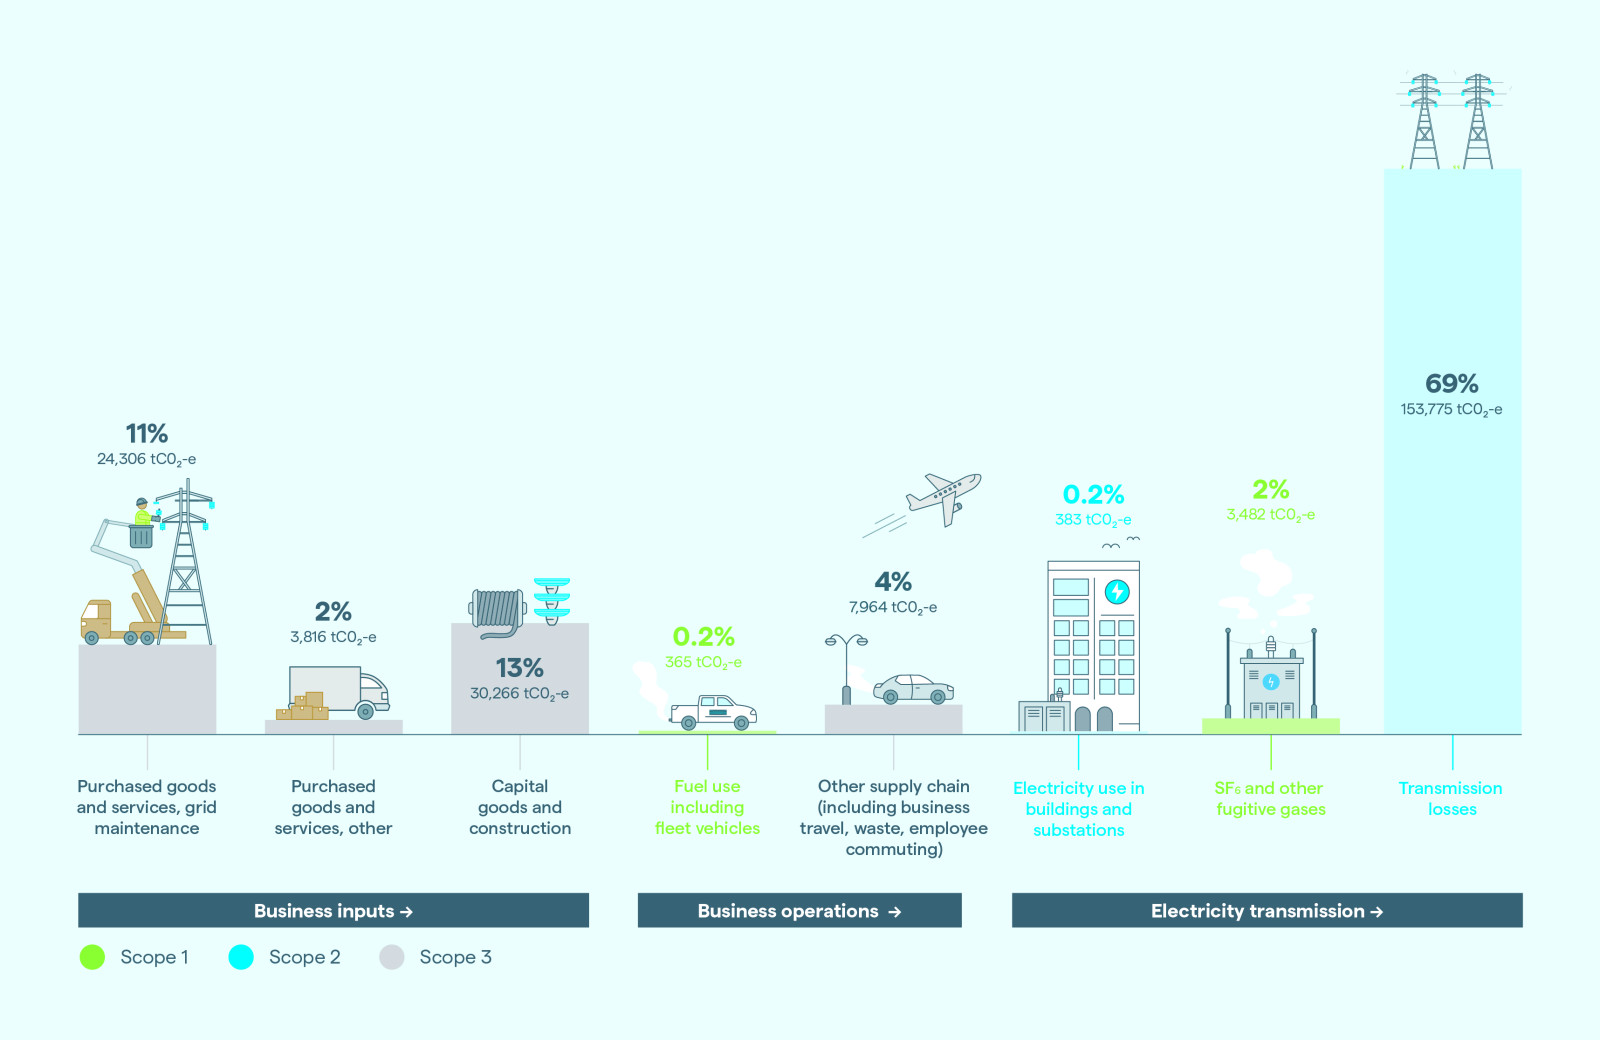
Our total emissions are estimated at 224,356 tonnes of carbon dioxide equivalent (tCO2e), an increase of 31,591 tCO₂e from FY2024.
For a detailed breakdown and for more information, read our FY2025 GHG Inventory Report here.
Scope 1: 3,847 tCO2e
Scope 1 emissions are those that arise directly from our operations. They include emissions from our use of fugitive gases and fuel usage in vehicles. Transpower is the country’s largest holder of sulphur hexafluoride (SF6), which we use as an insulating gas in our essential high-voltage switchgear.
Managing emissions from SF6 gases is an integral part of reducing Transpower’s carbon footprint. Our Sustainability Strategy and SF6 Management Strategy set out several initiatives to manage these losses as part of its 2030 and 2050 emission reduction targets, and Aotearoa New Zealand’s net-zero by 2050 aspirations.
This year, our SF6 emissions increased 9% from 3,091 tCO₂e reported in FY2024 figures to 3,376 tCO₂e in FY2025. In FY25 Transpower concluded a major milestone in our work on SF6 leak repairs. As a result, Transpower anticipated a considerable decrease in its SF6 emissions for FY2025. This was not realised due to incidents with four circuit breakers. All incidents have been investigated and addressed.
As outlined in our Sustainability Strategy, we’re continuing our long-running work programme to switch to electric vehicles where suitable options exist. As of FY2024, Transpower’s passenger fleet has 100% electric battery and/or plug in hybrid vehicles.
Scope 2: 154,157 tCO2e
Scope 2 emissions relate to electricity usage in our buildings and substations and includes non-controllable transmission losses (which is energy lost in transit along transmission and distribution networks as well as at substations) associated with operating the National Grid. Scope 2 emissions make up most of our carbon footprint, with transmission losses by far the largest contributor.
This year we have seen a 13% increase in transmission losses; from 135,928 tCO2e to 153,775 tCO2e.
GHG emissions arising from transmission losses across the National Grid fluctuate year-to-year. This is largely driven by climatic patterns, which in turn often influence third parties’ decisions in the Aotearoa New Zealand wholesale market about what electricity generation is made available and delivered in real-time. Generation patterns in turn impact the location of generation and the distance the generated electricity travels, which influences the amount of transmission losses arising in a given year. The generation mix impacts the amount of GHG emissions arising from such transmission losses (e.g., more rainfall often means more hydroelectricity and less coal or gas generation, which means less GHG emissions from transmission losses).
As part of our Sustainability Strategy, we are seeking to better understand Transpower’s role in transmission losses, focusing effort on areas within our control.
Scope 3: 66,351 tCO2e
In FY2025, the Scope 3 Categories with the highest emissions were Capital Goods (with a 45% increase) and Purchased Goods and Services (with an 8% increase). These increases reflect the anticipated rise in Scope 3 emissions given the step up in Transpower’s work programmes for FY2025. As these emissions include those arising from its service providers as they undertake Transpower’s work programmes, Transpower continues to work closely with its service providers to develop the National Grid sustainably.