The Energy Security Outlook (ESO) is a monthly report that helps track how secure New Zealand’s electricity supply might be over the next two years. It uses two key tools, the Electricity Risk Curves (ERCs) and Simulated Storage Trajectories (SSTs), to show how likely it is that we’ll have enough electricity, especially during dry periods when hydro lakes are low.
For more information on how it works and why it matters, we have published an 'ESO 101' document that covers how ERCs and SSTs help forecast electricity risks, what triggers action when supply looks tight, and how extra hydro storage can be used if needed.
June 2026 Energy Security Outlook
The Energy Risk Curves are evaluated through two lenses: the Fuel Capability Case (Base Case), which uses the original methodology based on total physical capability to source thermal fuels and utilise it for generation, and the Contracted Fuel Case, which strictly limits thermal energy to firm commercial contracts secured by generators. This approach highlights the gap between physical capability and actual commercial certainty, signalling to industry where additional fuel contracts can yet be secured to reduce security of supply energy risks.
In addition, this month's update includes a Reduced Rankine Availability scenario. This scenario evaluates how the reduced availability of Huntly Rankine units impacts the risk curves under both the Fuel Capability and Contracted Fuel cases.
- Base Case
The Fuel Capability Case (Base Case) assumes the market supplements the existing coal stockpile at its maximum import capability to maintain increased thermal generation during any extended periods of low hydro inflows.
Overall, there have been reductions to the risk curves for 2026 and 2027 due to a combination of:
- a modelling change to use the contracted gas volume if it's greater than the assumed physically available gas volume
- higher gas availability as a result of an increase in storage levels and slightly reduced gas production forecasts. These are unrelated to the global fuel shortage issue.
- partially offset by scheduled thermal outages later in 2026 and early 2027, and slightly later commissioning of new generation
No Simulated Storage Trajectories (SSTs) cross any curve in 2026 or 2027. This indicates a low risk of hydro storage depletion under expected market response.
National controlled hydro storage position is currently 130% of the historic mean with South Island storage at 128% (at 24 June), providing a strong early winter position. The June-August Climate Outlook from Earth Sciences NZ (formerly NIWA) is for "normal or below" or "below" rainfall for most of the country with the exception of the western South Island. Earth Sciences NZ expects strong El Niño conditions towards the end of winter 2026 which could improve inflows into major SI catchments.
Industry’s ongoing focus on hydro storage management and ensuring sufficient backup thermal fuels and capacity through winter continues to mitigate the potential for very high prices.The graphs below compare New Zealand and South Island base case controlled storage to the relevant Electricity Risk Status Curves.
Image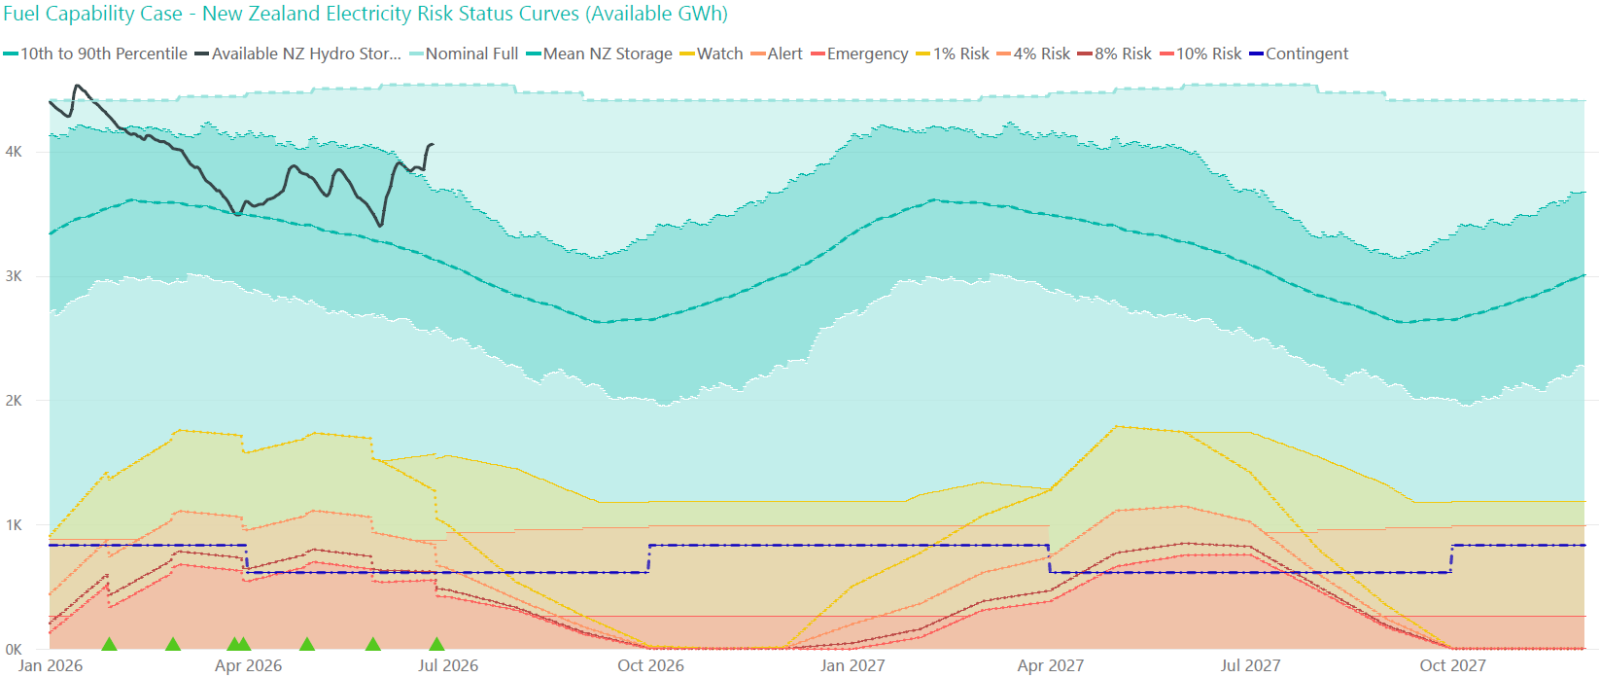 Image
Image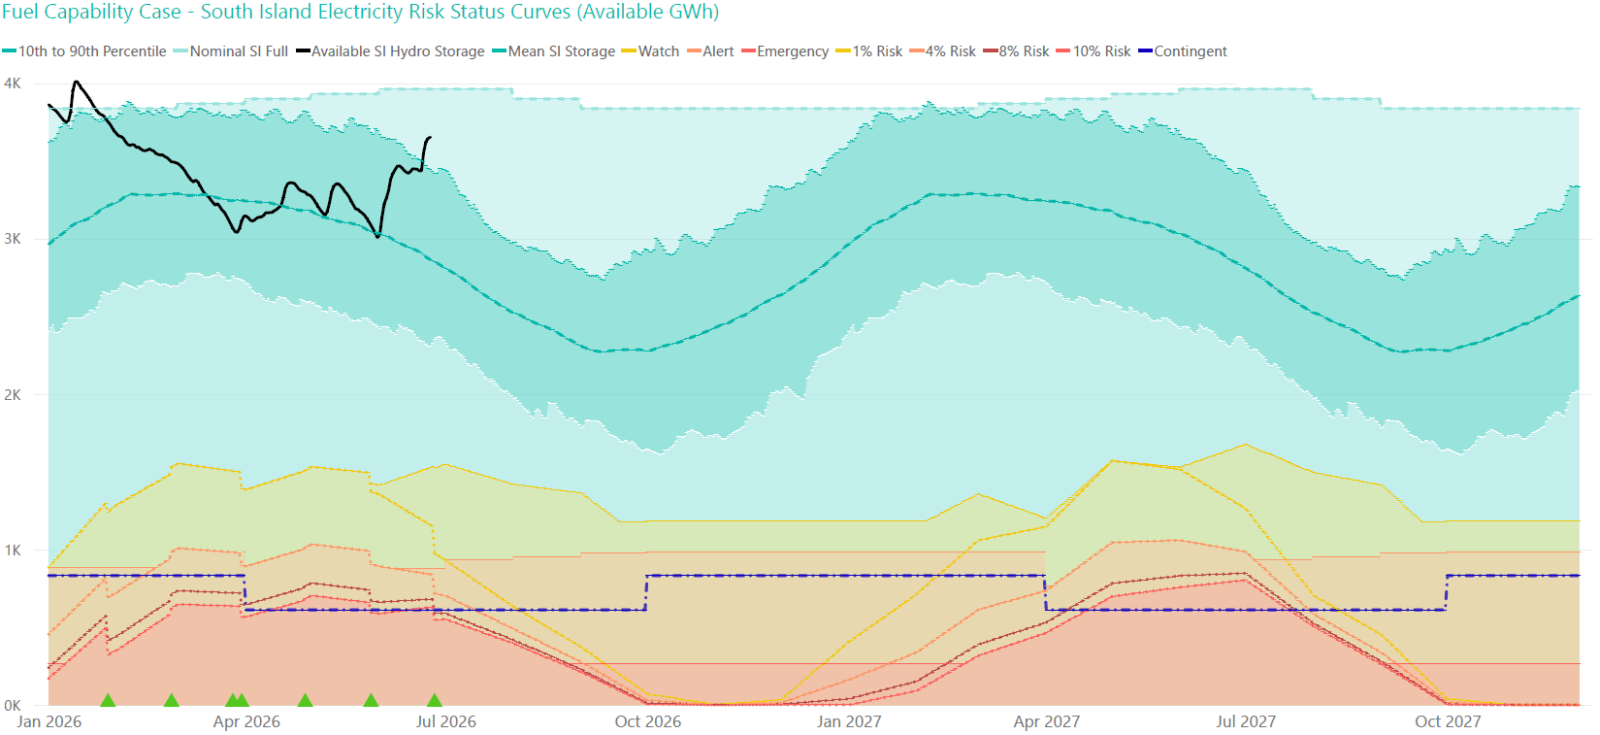
- Contracted Fuel Case
The Contracted Fuel Case assumes that only thermal fuel supplies currently secured through contractual arrangements are available for generation. Current thermal fuel contracts are sufficient to fuel most of the power system's thermal generation capability in 2026, reflecting a strong near-term contracted fuel position. As a result, SSTs only cross the risk curves a limited number of times in 2026:
- Watch twice and Alert once for New Zealand, and Watch twice and Alert twice for the South Island.
Should extended dry conditions emerge in 2026, additional thermal fuel contracts can help reduce the risk curves and raise the SSTs. The risk curves can reduce by up to ~209 GWh or ~36 Rankine days.
The gap between the Contracted Fuels and Fuel Capability Case risk curves becomes more pronounced in 2027 (diverging by up to ~950 GWh or ~165 Rankine days) and resulting in more SSTs crossing in 2027 (crossing Watch 14 times and Alert once for New Zealand, and crossing Watch 6 times for the South Island), reflecting the market's tendency to contract fuel closer to need.
By restricting available energy strictly to currently secured contracts, this Contracted Fuel case intentionally highlights the physical capacity that remains uncontracted, and the ability for additional contracting to reduce risks. This reinforces that contracted positions require continuous updating to provide ongoing security of supply cover.
The graphs below compare New Zealand and South Island Contract Fuel case controlled storage to the relevant Electricity Risk Status Curves.
Image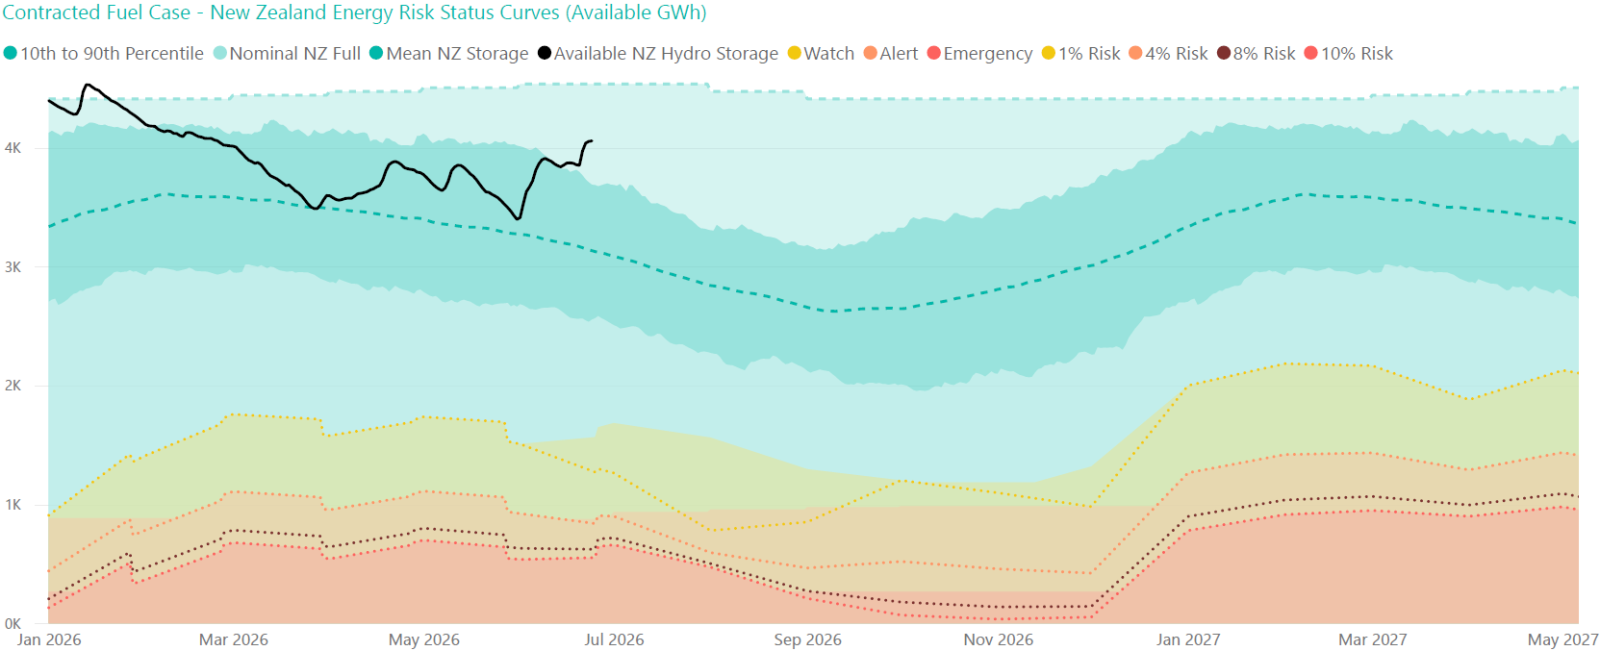 Image
Image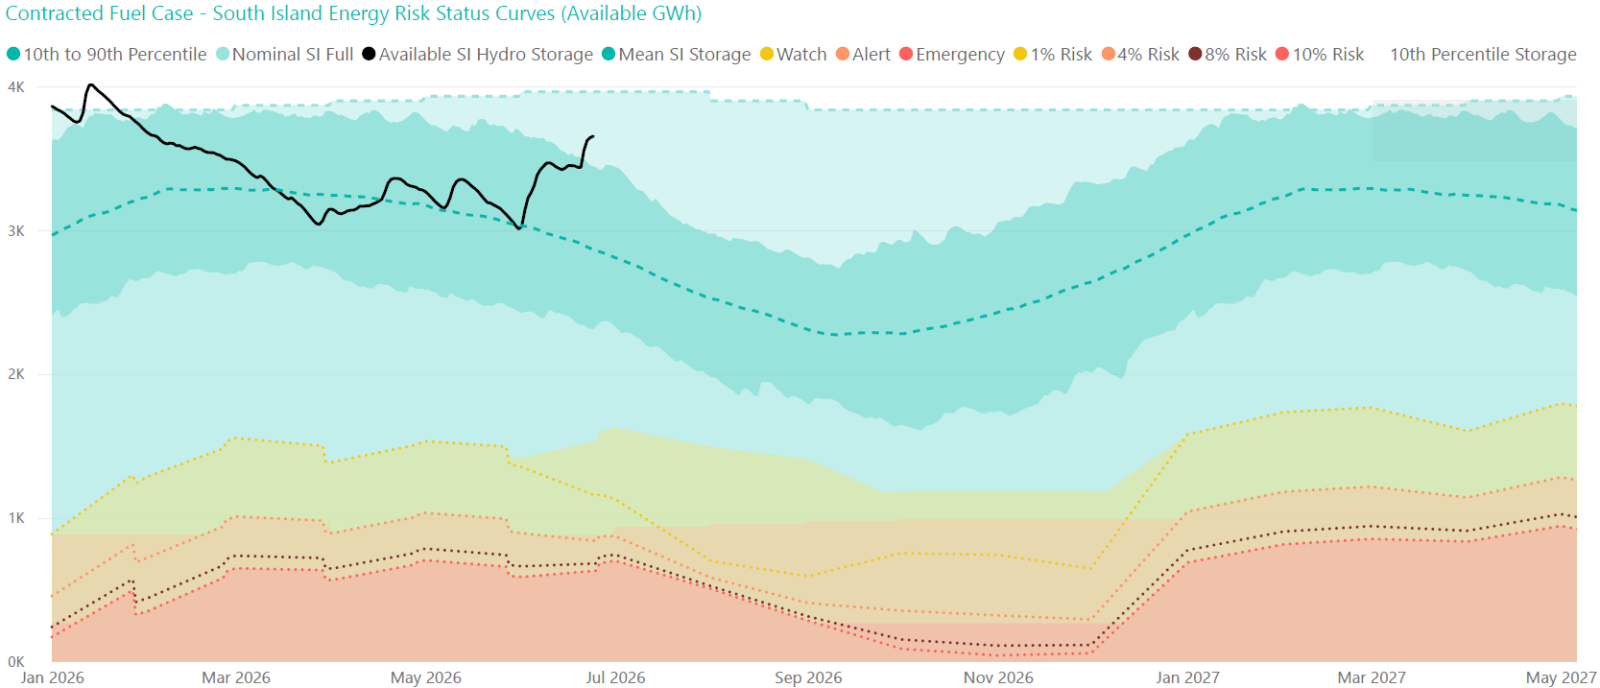
Related Files
Energy Security Outlook Data Files
Assumptions and Update Logs
- Scenarios
- Historic Logs