Demand, generation mix, HVDC transfer and prices can all indicate the market response to the current security of supply climate.
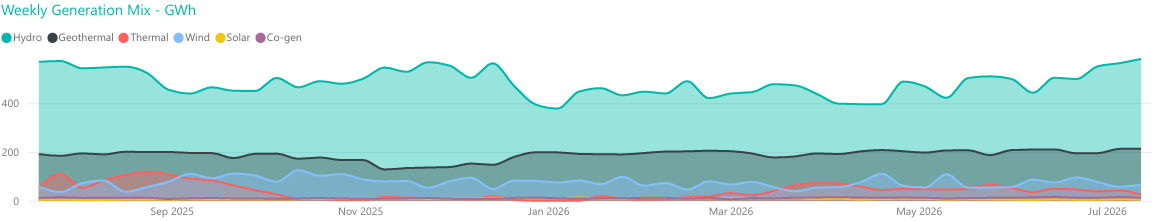
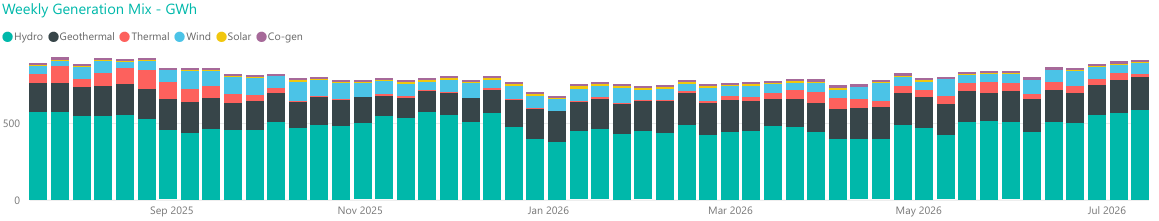
Weekly Generation
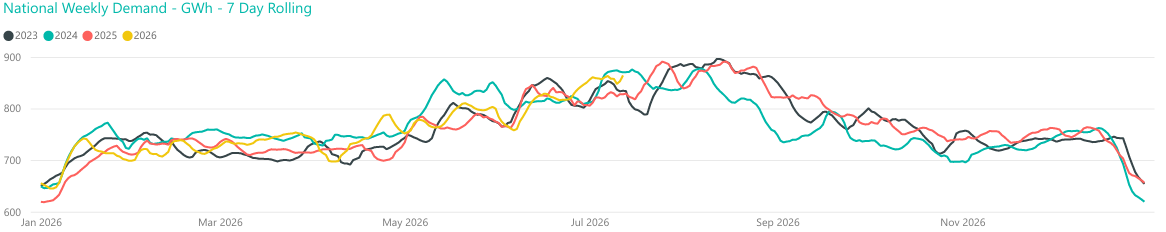
Demand
Electricity consumers range from large industrial sites (the most significant is the NZAS aluminium smelter at Tiwai), down to individual households. Almost two thirds of national demand is located in the North Island. New Zealand's annual electricity consumption ('demand') is nearly 40,000 gigawatt-hours (GWh). If demand differs from expected, it may impact on security of supply.
Generation
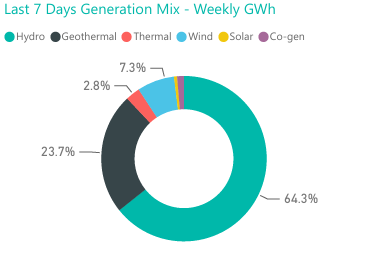
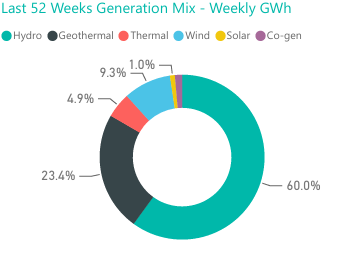
Hydroelectric generation contributes around 60% of New Zealand's total electricity supply, with many generators of widely varying sizes distributed throughout the country.
|
Image
|
Image
|
HVDC Transfer
The ability to transfer electricity from one island to the other is an important aspect of managing security of supply, particularly as there are no thermal stations in the South Island to call upon in times of low hydro storage. Net weekly HVDC transfer is shown in the chart below with north transfer from Benmore to Haywards and south transfer in the opposite direction.
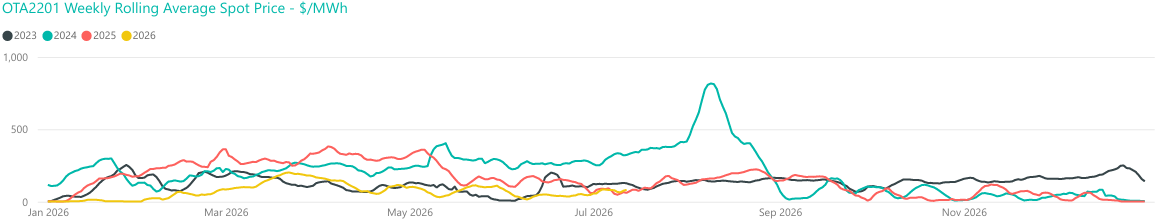
Wholesale Spot Prices
Spot prices can be an indicator of security of supply risk. Typically they rise when supply is tight, such as during 'dry years'. Weekly 7 day rolling spot prices for each island are shown in the graphs below. The corresponding prices for the previous year are also included for comparison.